Search This Blog

Translate

Wednesday, October 9, 2013

Face Boundary Detection Using Snake Algorithm

Get real time news update from your favorite websites.
Don't miss any news about your favorite topic.
Personalize your app.

Check out NTyles.


Get it on....

NTyles-App

Face boundary detection is one of the challenging task in the image processing. All the methods that you read taking a course using image processing will not help you in how to find out the boundaries of face -- from my own experience.
This post will be my continuation to my previous post. This post will really be very short.

I found a lot of articles regarding sanke algorithm in the web. I also found many of the example that discuss about finding the edge boundaries of insects, cell, DNA, molecules etc(source codes are also there ;) ). This post will just add a page in google that will help people finding the solution for detecting the face boudary using snake algorithm.

If you want to know about snake algorithm please go through this WIKI page. For the full source code of snake algorithm please refer here. Now all you have to do is give a face image as a input to the snake algorithm. Then select the probable face region in the input image. This face region will be Region Of Interest for the snake algorithm. Then set the required thresholds.As a output you will get a whole set of coordinates that bounds the face region. For all above process you will need ImageJ plugin that can be downloaded from here.

Snake algorithm really gives you a good result. For any confusion,Please don't get confused but rather let me know. :)

Happy Snake-ING!!

Saturday, July 20, 2013

Face Boundary Detection Using Extended Canny Edge Detection

Get real time news update from your favorite websites.
Don't miss any news about your favorite topic.
Personalize your app.

Check out NTyles.


Get it on....

NTyles-App


In my previous post I discussed more about Lucene basics. I will be discussing about them in future posts too. But this post is going to be totally different. I am bit moving towards Image Processing. So guys lets process our faces.

During my final year of Computer Engineering me along with other three guys did a project entitled "FACE REPLACEMENT SYSTEM". Face Replacement System is a semi-automatic software system which can be used to replace face of one person(target face) with that of another person(source face) in a photograph.

In the project Face Replacement System, my major role was to extract face region (face boundary) from photograph. So in this post I will be more discussing about Face Boundary Region Extraction. Face boundary region extraction is the process of detecting the face region in an image.

The face replacement system project lead us to the finding of three main algorithms for finding the Face Boundary of the face. They are:
  • Skin Color Thresholding.
  • Canny Edge Detection.
  • Adaptive active contour model (Snake Algorithm).
Among above I will not discuss about Skin Color Thresholding. There are many places on the web where you can search about it. In this post I will talk about Canny Edge Detection. And in upcoming post I will talk about Adaptive active contour model i.e. snake algorithm.

CANNY EDGE DETECTION
Edge Detection is another method of face region extraction. The basic idea is to detect edges around the face so that the boundary around the face can be extracted. The edge detection process consists of two phases:
i.  Canny Edge Detection
ii. Longest Edge Detectio

i.  Canny Edge Detection 
Canny Edge Detection is one of the most popular edge detection techniques. Detecting edges in an image filters out useless information. The Canny Edge Algorithm uses two thresholds, high and low thresholds. The value of low threshold is (0.4 x (high threshold)). The two values of thresholds are used to distinguish between strong and weak edges by the values of strength of the edges. To find the strength of edges, longest edge detection algorithm is used. Also the weak edge length is considered if and only if they are connected with the long edges. The output of Canny Edge Detection is a binary image. This binary image is regarded as the edge map for our face contour extraction algorithm.
Canny Edge Detection is used to detect the edges. For the detection of edges of face region, a probable rectangle region including face is selected with the help of the separation of the eyes. If the separation between two eyes is ‘2D’ then the width of the probable rectangular region is defined to be ‘5D’ and the height is defined to be ‘8D’ as shown in  Figure 1.0.
After the rectangular region is extracted, the rectangle is divided into four parts: forehead of dimension (5D x D), left face of dimension (D x 7D), right face of dimension (D x 7D), and
bottom face of dimension (5D x D) as shown in Figure 1.1.

Face Boundary Detection

 Then, in each of the above parts, Canny Edge Detection is applied. The final result is shown in Figure 1.2.
Face Boundary Detection


Below is the java code for finding Canny Edge(I didn't code it) :

 
/*
 * To change this template, choose Tools | Templates
 * and open the template in the editor.
 */
package Image;

import java.awt.image.BufferedImage;
import java.util.Arrays;

/**
 * This software has been released into the public domain.
 * Please read the notes in this source file for additional information.
 * 


 * 
 * This class provides a configurable implementation of the Canny edge
 * detection algorithm. This classic algorithm has a number of shortcomings,
 * but remains an effective tool in many scenarios. This class is designed
 * for single threaded use only.


 * 
 * Sample usage:


 * 
 * 

 * //create the detector
 * CannyEdgeDetector detector = new CannyEdgeDetector();
 * //adjust its parameters as desired
 * detector.setLowThreshold(0.5f);
 * detector.setHighThreshold(1f);
 * //apply it to an image
 * detector.setSourceImage(frame);
 * detector.process();
 * BufferedImage edges = detector.getEdgesImage();
 * 
* * For a more complete understanding of this edge detector's parameters * consult an explanation of the algorithm. * * @author Tom Gibara * */ public class CannyEdgeDetector { // statics private final static float GAUSSIAN_CUT_OFF = 0.005f; private final static float MAGNITUDE_SCALE = 100F; private final static float MAGNITUDE_LIMIT = 1000F; private final static int MAGNITUDE_MAX = (int) (MAGNITUDE_SCALE * MAGNITUDE_LIMIT); // fields private int height; private int width; private int picsize; private int[] data; private int[] magnitude; private BufferedImage sourceImage; private BufferedImage edgesImage; private float gaussianKernelRadius; private float lowThreshold; private float highThreshold; private int gaussianKernelWidth; private boolean contrastNormalized; private float[] xConv; private float[] yConv; private float[] xGradient; private float[] yGradient; // constructors /** * Constructs a new detector with default parameters. */ public CannyEdgeDetector() { lowThreshold = 2.5f; highThreshold = 7.5f; gaussianKernelRadius = 2f; gaussianKernelWidth = 16; contrastNormalized = false; } // accessors /** * The image that provides the luminance data used by this detector to * generate edges. * * @return the source image, or null */ public BufferedImage getSourceImage() { return sourceImage; } /** * Specifies the image that will provide the luminance data in which edges * will be detected. A source image must be set before the process method * is called. * * @param image a source of luminance data */ public void setSourceImage(BufferedImage image) { sourceImage = image; } /** * Obtains an image containing the edges detected during the last call to * the process method. The buffered image is an opaque image of type * BufferedImage.TYPE_INT_ARGB in which edge pixels are white and all other * pixels are black. * * @return an image containing the detected edges, or null if the process * method has not yet been called. */ public BufferedImage getEdgesImage() { return edgesImage; } /** * Sets the edges image. Calling this method will not change the operation * of the edge detector in any way. It is intended to provide a means by * which the memory referenced by the detector object may be reduced. * * @param edgesImage expected (though not required) to be null */ public void setEdgesImage(BufferedImage edgesImage) { this.edgesImage = edgesImage; } /** * The low threshold for hysteresis. The default value is 2.5. * * @return the low hysteresis threshold */ public float getLowThreshold() { return lowThreshold; } /** * Sets the low threshold for hysteresis. Suitable values for this parameter * must be determined experimentally for each application. It is nonsensical * (though not prohibited) for this value to exceed the high threshold value. * * @param threshold a low hysteresis threshold */ public void setLowThreshold(float threshold) { if (threshold < 0) throw new IllegalArgumentException(); lowThreshold = threshold; } /** * The high threshold for hysteresis. The default value is 7.5. * * @return the high hysteresis threshold */ public float getHighThreshold() { return highThreshold; } /** * Sets the high threshold for hysteresis. Suitable values for this * parameter must be determined experimentally for each application. It is * nonsensical (though not prohibited) for this value to be less than the * low threshold value. * * @param threshold a high hysteresis threshold */ public void setHighThreshold(float threshold) { if (threshold < 0) throw new IllegalArgumentException(); highThreshold = threshold; } /** * The number of pixels across which the Gaussian kernel is applied. * The default value is 16. * * @return the radius of the convolution operation in pixels */ public int getGaussianKernelWidth() { return gaussianKernelWidth; } /** * The number of pixels across which the Gaussian kernel is applied. * This implementation will reduce the radius if the contribution of pixel * values is deemed negligable, so this is actually a maximum radius. * * @param gaussianKernelWidth a radius for the convolution operation in * pixels, at least 2. */ public void setGaussianKernelWidth(int gaussianKernelWidth) { if (gaussianKernelWidth < 2) throw new IllegalArgumentException(); this.gaussianKernelWidth = gaussianKernelWidth; } /** * The radius of the Gaussian convolution kernel used to smooth the source * image prior to gradient calculation. The default value is 16. * * @return the Gaussian kernel radius in pixels */ public float getGaussianKernelRadius() { return gaussianKernelRadius; } /** * Sets the radius of the Gaussian convolution kernel used to smooth the * source image prior to gradient calculation. * * @return a Gaussian kernel radius in pixels, must exceed 0.1f. */ public void setGaussianKernelRadius(float gaussianKernelRadius) { if (gaussianKernelRadius < 0.1f) throw new IllegalArgumentException(); this.gaussianKernelRadius = gaussianKernelRadius; } /** * Whether the luminance data extracted from the source image is normalized * by linearizing its histogram prior to edge extraction. The default value * is false. * * @return whether the contrast is normalized */ public boolean isContrastNormalized() { return contrastNormalized; } /** * Sets whether the contrast is normalized * @param contrastNormalized true if the contrast should be normalized, * false otherwise */ public void setContrastNormalized(boolean contrastNormalized) { this.contrastNormalized = contrastNormalized; } // methods public void process() { width = sourceImage.getWidth(); height = sourceImage.getHeight(); picsize = width * height; initArrays(); readLuminance(); if (contrastNormalized) normalizeContrast(); computeGradients(gaussianKernelRadius, gaussianKernelWidth); int low = Math.round(lowThreshold * MAGNITUDE_SCALE); int high = Math.round( highThreshold * MAGNITUDE_SCALE); performHysteresis(low, high); thresholdEdges(); writeEdges(data); } // private utility methods private void initArrays() { if (data == null || picsize != data.length) { data = new int[picsize]; magnitude = new int[picsize]; xConv = new float[picsize]; yConv = new float[picsize]; xGradient = new float[picsize]; yGradient = new float[picsize]; } } //NOTE: The elements of the method below (specifically the technique for //non-maximal suppression and the technique for gradient computation) //are derived from an implementation posted in the following forum (with the //clear intent of others using the code): // http://forum.java.sun.com/thread.jspa?threadID=546211&start=45&tstart=0 //My code effectively mimics the algorithm exhibited above. //Since I don't know the providence of the code that was posted it is a //possibility (though I think a very remote one) that this code violates //someone's intellectual property rights. If this concerns you feel free to //contact me for an alternative, though less efficient, implementation. private void computeGradients(float kernelRadius, int kernelWidth) { //generate the gaussian convolution masks float kernel[] = new float[kernelWidth]; float diffKernel[] = new float[kernelWidth]; int kwidth; for (kwidth = 0; kwidth < kernelWidth; kwidth++) { float g1 = gaussian(kwidth, kernelRadius); if (g1 <= GAUSSIAN_CUT_OFF && kwidth >= 2) break; float g2 = gaussian(kwidth - 0.5f, kernelRadius); float g3 = gaussian(kwidth + 0.5f, kernelRadius); kernel[kwidth] = (g1 + g2 + g3) / 3f / (2f * (float) Math.PI * kernelRadius * kernelRadius); diffKernel[kwidth] = g3 - g2; } int initX = kwidth - 1; int maxX = width - (kwidth - 1); int initY = width * (kwidth - 1); int maxY = width * (height - (kwidth - 1)); //perform convolution in x and y directions for (int x = initX; x < maxX; x++) { for (int y = initY; y < maxY; y += width) { int index = x + y; float sumX = data[index] * kernel[0]; float sumY = sumX; int xOffset = 1; int yOffset = width; for(; xOffset < kwidth ;) { sumY += kernel[xOffset] * (data[index - yOffset] + data[index + yOffset]); sumX += kernel[xOffset] * (data[index - xOffset] + data[index + xOffset]); yOffset += width; xOffset++; } yConv[index] = sumY; xConv[index] = sumX; } } for (int x = initX; x < maxX; x++) { for (int y = initY; y < maxY; y += width) { float sum = 0f; int index = x + y; for (int i = 1; i < kwidth; i++) sum += diffKernel[i] * (yConv[index - i] - yConv[index + i]); xGradient[index] = sum; } } for (int x = kwidth; x < width - kwidth; x++) { for (int y = initY; y < maxY; y += width) { float sum = 0.0f; int index = x + y; int yOffset = width; for (int i = 1; i < kwidth; i++) { sum += diffKernel[i] * (xConv[index - yOffset] - xConv[index + yOffset]); yOffset += width; } yGradient[index] = sum; } } initX = kwidth; maxX = width - kwidth; initY = width * kwidth; maxY = width * (height - kwidth); for (int x = initX; x < maxX; x++) { for (int y = initY; y < maxY; y += width) { int index = x + y; int indexN = index - width; int indexS = index + width; int indexW = index - 1; int indexE = index + 1; int indexNW = indexN - 1; int indexNE = indexN + 1; int indexSW = indexS - 1; int indexSE = indexS + 1; float xGrad = xGradient[index]; float yGrad = yGradient[index]; float gradMag = hypot(xGrad, yGrad); //perform non-maximal supression float nMag = hypot(xGradient[indexN], yGradient[indexN]); float sMag = hypot(xGradient[indexS], yGradient[indexS]); float wMag = hypot(xGradient[indexW], yGradient[indexW]); float eMag = hypot(xGradient[indexE], yGradient[indexE]); float neMag = hypot(xGradient[indexNE], yGradient[indexNE]); float seMag = hypot(xGradient[indexSE], yGradient[indexSE]); float swMag = hypot(xGradient[indexSW], yGradient[indexSW]); float nwMag = hypot(xGradient[indexNW], yGradient[indexNW]); float tmp; /* * An explanation of what's happening here, for those who want * to understand the source: This performs the "non-maximal * supression" phase of the Canny edge detection in which we * need to compare the gradient magnitude to that in the * direction of the gradient; only if the value is a local * maximum do we consider the point as an edge candidate. * * We need to break the comparison into a number of different * cases depending on the gradient direction so that the * appropriate values can be used. To avoid computing the * gradient direction, we use two simple comparisons: first we * check that the partial derivatives have the same sign (1) * and then we check which is larger (2). As a consequence, we * have reduced the problem to one of four identical cases that * each test the central gradient magnitude against the values at * two points with 'identical support'; what this means is that * the geometry required to accurately interpolate the magnitude * of gradient function at those points has an identical * geometry (upto right-angled-rotation/reflection). * * When comparing the central gradient to the two interpolated * values, we avoid performing any divisions by multiplying both * sides of each inequality by the greater of the two partial * derivatives. The common comparand is stored in a temporary * variable (3) and reused in the mirror case (4). * */ if (xGrad * yGrad <= (float) 0 /*(1)*/ ? Math.abs(xGrad) >= Math.abs(yGrad) /*(2)*/ ? (tmp = Math.abs(xGrad * gradMag)) >= Math.abs(yGrad * neMag - (xGrad + yGrad) * eMag) /*(3)*/ && tmp > Math.abs(yGrad * swMag - (xGrad + yGrad) * wMag) /*(4)*/ : (tmp = Math.abs(yGrad * gradMag)) >= Math.abs(xGrad * neMag - (yGrad + xGrad) * nMag) /*(3)*/ && tmp > Math.abs(xGrad * swMag - (yGrad + xGrad) * sMag) /*(4)*/ : Math.abs(xGrad) >= Math.abs(yGrad) /*(2)*/ ? (tmp = Math.abs(xGrad * gradMag)) >= Math.abs(yGrad * seMag + (xGrad - yGrad) * eMag) /*(3)*/ && tmp > Math.abs(yGrad * nwMag + (xGrad - yGrad) * wMag) /*(4)*/ : (tmp = Math.abs(yGrad * gradMag)) >= Math.abs(xGrad * seMag + (yGrad - xGrad) * sMag) /*(3)*/ && tmp > Math.abs(xGrad * nwMag + (yGrad - xGrad) * nMag) /*(4)*/ ) { magnitude[index] = gradMag >= MAGNITUDE_LIMIT ? MAGNITUDE_MAX : (int) (MAGNITUDE_SCALE * gradMag); //NOTE: The orientation of the edge is not employed by this //implementation. It is a simple matter to compute it at //this point as: Math.atan2(yGrad, xGrad); } else { magnitude[index] = 0; } } } } //NOTE: It is quite feasible to replace the implementation of this method //with one which only loosely approximates the hypot function. I've tested //simple approximations such as Math.abs(x) + Math.abs(y) and they work fine. private float hypot(float x, float y) { return (float) Math.hypot(x, y); } private float gaussian(float x, float sigma) { return (float) Math.exp(-(x * x) / (2f * sigma * sigma)); } private void performHysteresis(int low, int high) { //NOTE: this implementation reuses the data array to store both //luminance data from the image, and edge intensity from the processing. //This is done for memory efficiency, other implementations may wish //to separate these functions. Arrays.fill(data, 0); int offset = 0; for (int y = 0; y < height; y++) { for (int x = 0; x < width; x++) { if (data[offset] == 0 && magnitude[offset] >= high) { follow(x, y, offset, low); } offset++; } } } private void follow(int x1, int y1, int i1, int threshold) { int x0 = x1 == 0 ? x1 : x1 - 1; int x2 = x1 == width - 1 ? x1 : x1 + 1; int y0 = y1 == 0 ? y1 : y1 - 1; int y2 = y1 == height -1 ? y1 : y1 + 1; data[i1] = magnitude[i1]; for (int x = x0; x <= x2; x++) { for (int y = y0; y <= y2; y++) { int i2 = x + y * width; if ((y != y1 || x != x1) && data[i2] == 0 && magnitude[i2] >= threshold) { follow(x, y, i2, threshold); return; } } } } private void thresholdEdges() { for (int i = 0; i < picsize; i++) { data[i] = data[i] > 0 ? -1 : 0xff000000; } } private int luminance(float r, float g, float b) { return Math.round(0.299f * r + 0.587f * g + 0.114f * b); } private void readLuminance() { int type = sourceImage.getType(); if (type == BufferedImage.TYPE_INT_RGB || type == BufferedImage.TYPE_INT_ARGB) { int[] pixels = (int[]) sourceImage.getData().getDataElements(0, 0, width, height, null); for (int i = 0; i < picsize; i++) { int p = pixels[i]; int r = (p & 0xff0000) >> 16; int g = (p & 0xff00) >> 8; int b = p & 0xff; data[i] = luminance(r, g, b); } } else if (type == BufferedImage.TYPE_BYTE_GRAY) { byte[] pixels = (byte[]) sourceImage.getData().getDataElements(0, 0, width, height, null); for (int i = 0; i < picsize; i++) { data[i] = (pixels[i] & 0xff); } } else if (type == BufferedImage.TYPE_USHORT_GRAY) { short[] pixels = (short[]) sourceImage.getData().getDataElements(0, 0, width, height, null); for (int i = 0; i < picsize; i++) { data[i] = (pixels[i] & 0xffff) / 256; } } else if (type == BufferedImage.TYPE_3BYTE_BGR) { byte[] pixels = (byte[]) sourceImage.getData().getDataElements(0, 0, width, height, null); int offset = 0; for (int i = 0; i < picsize; i++) { int b = pixels[offset++] & 0xff; int g = pixels[offset++] & 0xff; int r = pixels[offset++] & 0xff; data[i] = luminance(r, g, b); } } else { throw new IllegalArgumentException("Unsupported image type: " + type); } } private void normalizeContrast() { int[] histogram = new int[256]; for (int i = 0; i < data.length; i++) { histogram[data[i]]++; } int[] remap = new int[256]; int sum = 0; int j = 0; for (int i = 0; i < histogram.length; i++) { sum += histogram[i]; int target = sum*255/picsize; for (int k = j+1; k <=target; k++) { remap[k] = i; } j = target; } for (int i = 0; i < data.length; i++) { data[i] = remap[data[i]]; } } private void writeEdges(int pixels[]) { //NOTE: There is currently no mechanism for obtaining the edge data //in any other format other than an INT_ARGB type BufferedImage. //This may be easily remedied by providing alternative accessors. if (edgesImage == null) { edgesImage = new BufferedImage(width, height, BufferedImage.TYPE_INT_ARGB); } edgesImage.getWritableTile(0, 0).setDataElements(0, 0, width, height, pixels); } }
ii. Longest Edge Detection
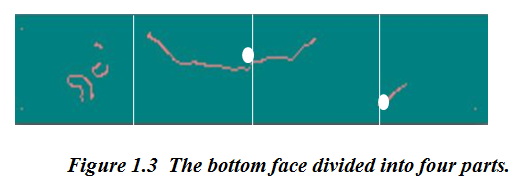
 The two images i.e. forehead image and bottom face image are divided vertically into four parts. Each divided certainly cuts out edges. The divided region of bottom face is shown in Figure 1.3.
The output of Canny Edge Detection of four parts of face image contains many edges including weak and strong edges. We are only interested with the long and strong edges. For the detection of such long edges we have performed following steps:
Step 1:
Face Boundary Detection


Step 2:
Edge is grown from the point of intersection with the boundary. In this algorithm, the edge is followed from left to right. The edge is considered to be a strong edge if its length is greater than a threshold length, T.
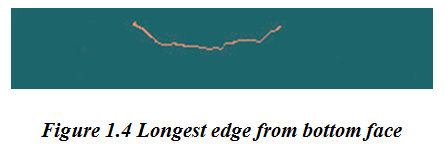
Step 3:
Weak edges are removed. The image obtained after removal of weak edges is shown in Figure 1.4.
Face Boundary Detection

Step 4:
The same process is applied to all four parts. The same process is applied to the left and right regions, but the regions are divided according to the height. The final probable edge image is shown in Figure 1.5.
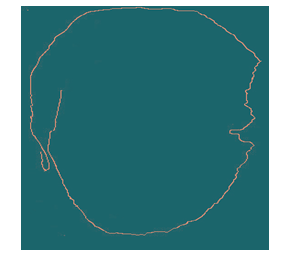
Face Boundary Detection


Step 5:
After the probable edge maps are found out using canny edge detection, all the edges are linked together using either “Hough Transform” or “Active Contour Model”. See Figure 1.6 for final output :
Face Boundary Detection
Figure 1.6 : Result after active contour Model.


This is all about how to get the face edge boundary using Canny Edge Detection.

In my next blog I will write about extracting face region using Snake Algorithm.

Wednesday, July 17, 2013

How to use Lucene Highlighter.

Get real time news update from your favorite websites.
Don't miss any news about your favorite topic.
Personalize your app.

Check out NTyles.


Get it on....

NTyles-App


In my previous blog I show you some java code for calculating cosine similarity, tfidf and generating document vectors using tfidf.
Somebody recently asked me about highlighting a search results using Lucene. I also didn't knew that Lucene has the highlighting capability. I googled a little and did some experiments of my own. So this post is totally dedicated for those who want to learn lucene highlighter.

What is Highlight in Lucene?
Highlighting in Lucene means getting the search word along with other keywords alongside with it.
As in lucene document getting the "keyword in context". Highlighting helps in getting the parts of the text related to the search word. As for example if I search for Highlight in Google then this will give me related search articles containing text like "Lucene highlighter" , "How to use Lucene  Highlighter", "Lucene Highlighter rocks" and etc, etc.

Highlighter is the main central class and this class is used to extract the intresting parts of the search word hits and highlight them. By highlight, I mean, one can color the intresting result, bold them. Above all one can format the intresting part of the search hit by using the format given by Lucene Highlighter. For this formatting purpose there are classes like :
  • Formatter
  • Fragmenter
Implementing Lucene Highlighter in java:
For this post I am using Lucene 4.2.1. For Lucene 4.2.1 the highlighter library is lucene-highlighter-4.2.1.jar  which resides in the folder "Highlighter" after you unzip the downloaded extract. There are overall three highlighter packages in Lucene :
  1. org.apache.lucene.search.highlight
  2. org.apache.lucene.search.postinghighlight
  3. org.apache.lucene.search.vectorhighlight
Among the above three I will be explaining only first one. If you want to learn the other two you can refer to lucene documentation.  Without furthur ado let me introduce to you the steps involved in making lucene highlighter work out:

Step 1 :
     Create a Lucene document with two fields one with term vector enabled and another without term vector.
Below is the java code on how to create a Lucene document with two fields. One with term vector enabled and another without term vector.


        Document doc = new Document(); //create a new document
        
        /**
        *Create a field with term vector enabled
         */
        FieldType type = new FieldType();
        type.setIndexed(true);
        type.setIndexOptions(FieldInfo.IndexOptions.DOCS_AND_FREQS_AND_POSITIONS_AND_OFFSETS);
        type.setStored(true);
        type.setStoreTermVectors(true);
        type.setTokenized(true);
        type.setStoreTermVectorOffsets(true);
        Field field = new Field("content", "Lucene Highlighter rocks", type);//with term vector enabled
        /***/
        TextField f =new TextField("ncontent","Lucene Highlighter rocks", Field.Store.YES); //without term vector
        /**
         * Add above two field to document
         */
        doc.add(field);
        doc.add(f);


Step 2 : 
Add the documents created by "Step 1 " in Lucene Index. Read How To Make Lucene Index.
For those who don't know how to make a index in lucene please refer "Use Lucene to Index Files".

Step 3 :
Integrate Lucene Highlighter into your search engine of lucene.
Below is the code on using lucene  highlighter:

/*
 * To change this template, choose Tools | Templates
 * and open the template in the editor.
 */
package com.computergodzilla.highlighter;

import java.io.File;
import java.io.IOException;
import org.apache.lucene.analysis.Analyzer;
import org.apache.lucene.analysis.TokenStream;
import org.apache.lucene.analysis.standard.StandardAnalyzer;
import org.apache.lucene.document.Document;
import org.apache.lucene.index.DirectoryReader;
import org.apache.lucene.index.IndexReader;
import org.apache.lucene.queryparser.classic.ParseException;
import org.apache.lucene.queryparser.classic.QueryParser;
import org.apache.lucene.search.IndexSearcher;
import org.apache.lucene.search.Query;
import org.apache.lucene.search.TopDocs;
import org.apache.lucene.search.highlight.Highlighter;
import org.apache.lucene.search.highlight.InvalidTokenOffsetsException;
import org.apache.lucene.search.highlight.QueryScorer;
import org.apache.lucene.search.highlight.SimpleHTMLFormatter;
import org.apache.lucene.search.highlight.TextFragment;
import org.apache.lucene.search.highlight.TokenSources;
import org.apache.lucene.store.FSDirectory;
import org.apache.lucene.util.Version;

/**
 * Example of Lucene Highlighter
 * @author Mubin Shrestha
 */
public class LuceneHighlighter {

    public void highLighter() throws IOException, ParseException, InvalidTokenOffsetsException {
        IndexReader reader = DirectoryReader.open(FSDirectory.open(new File("D:/INDEXDIRECTORY")));
        Analyzer analyzer = new StandardAnalyzer(Version.LUCENE_42);
        IndexSearcher searcher = new IndexSearcher(reader);
        QueryParser parser = new QueryParser(Version.LUCENE_42, "ncontent", analyzer);
        Query query = parser.parse("going");
        TopDocs hits = searcher.search(query, reader.maxDoc());
        System.out.println(hits.totalHits);
        SimpleHTMLFormatter htmlFormatter = new SimpleHTMLFormatter();
        Highlighter highlighter = new Highlighter(htmlFormatter, new QueryScorer(query));
        for (int i = 0; i < reader.maxDoc(); i++) {
            int id = hits.scoreDocs[i].doc;
            Document doc = searcher.doc(id);
            String text = doc.get("ncontent");
            TokenStream tokenStream = TokenSources.getAnyTokenStream(searcher.getIndexReader(), id, "ncontent", analyzer);
            TextFragment[] frag = highlighter.getBestTextFragments(tokenStream, text, false, 4);
            for (int j = 0; j < frag.length; j++) {
                if ((frag[j] != null) && (frag[j].getScore() > 0)) {
                    System.out.println((frag[j].toString()));
                }
            }
            //Term vector
            text = doc.get("content");
            tokenStream = TokenSources.getAnyTokenStream(searcher.getIndexReader(), hits.scoreDocs[i].doc, "content", analyzer);
            frag = highlighter.getBestTextFragments(tokenStream, text, false, 4);
            for (int j = 0; j < frag.length; j++) {
                if ((frag[j] != null) && (frag[j].getScore() > 0)) {
                    System.out.println((frag[j].toString()));
                }
            }
        }
    }
}


All the steps are complete.
The above code will make the texts with context to search word bold when the output are open in any browser.

Happy Highliting!! 

Friday, July 12, 2013

How To Calculate Tf-Idf and Cosine Similarity using JAVA.

Get real time news update from your favorite websites.
Don't miss any news about your favorite topic.
Personalize your app.

Check out NTyles.


Get it on....

NTyles-App


NOTE: Lucene 4.x users please do refer
Calculate Cosine Similarity Using Lucene

For beginners doing a project in text mining aches them a lot by various term like :
  • TF-IDF
  • COSINE SIMILARITY
  • CLUSTERING
  • DOCUMENT VECTORS
In my earlier post I showed you guys what is Cosine Similarity. I will not talk about Cosine Similarity in this post but rather I will show a nice little code to calculate Cosine Similarity in java.

Many of you must be familiar with Tf-Idf(Term frequency-Inverse Document Frequency).
I will enlighten them in brief.

Term Frequency:
Suppose for a document "Tf-Idf Brief Introduction" there are overall 60000 words and a word Term-Frequency occurs 60 times.
Then , mathematically, its Term Frequency, TF = 60/60000 =0.001.

Inverse Document Frequency:
Suppose one bought Harry-Potter series, all series. Suppose there are 7 series and a word "AbraKaDabra" comes in 2 of the series.
Then, mathematically, its Inverse-Document Frequency , IDF = 1 + log(7/2) = .......(calculated it guys, don't be lazy, I am lazy not you guys.)

And Finally, TFIDF = TF * IDF;

By mathematically I assume you now know its meaning physically.

Document Vector:
There are various ways to calculate document vectors. I am just giving you an example. Suppose If I calculate all the term's TF-IDF of a document A and store them in an array(list, matrix ... in any ordered way, .. you guys are genius you know how to create a vector. ) then I get an Document Vector of TF-IDF scores of document A.

The class shown below calculates the Term Frequency(TF) and Inverse Document Frequency(IDF).

//TfIdf.java
package com.computergodzilla.tfidf;

import java.util.List;

/**
 * Class to calculate TfIdf of term.
 * @author Mubin Shrestha
 */
public class TfIdf {
    
    /**
     * Calculates the tf of term termToCheck
     * @param totalterms : Array of all the words under processing document
     * @param termToCheck : term of which tf is to be calculated.
     * @return tf(term frequency) of term termToCheck
     */
    public double tfCalculator(String[] totalterms, String termToCheck) {
        double count = 0;  //to count the overall occurrence of the term termToCheck
        for (String s : totalterms) {
            if (s.equalsIgnoreCase(termToCheck)) {
                count++;
            }
        }
        return count / totalterms.length;
    }

    /**
     * Calculates idf of term termToCheck
     * @param allTerms : all the terms of all the documents
     * @param termToCheck
     * @return idf(inverse document frequency) score
     */
    public double idfCalculator(List allTerms, String termToCheck) {
        double count = 0;
        for (String[] ss : allTerms) {
            for (String s : ss) {
                if (s.equalsIgnoreCase(termToCheck)) {
                    count++;
                    break;
                }
            }
        }
        return 1 + Math.log(allTerms.size() / count);
    }
}


The class shown below parsed the text documents and split them into tokens. This class will communicate with TfIdf.java class to calculated TfIdf. It also calls CosineSimilarity.java class to calculated the similarity between the passed documents.

//DocumentParser.java

package com.computergodzilla.tfidf;

import java.io.BufferedReader;
import java.io.File;
import java.io.FileNotFoundException;
import java.io.FileReader;
import java.io.IOException;
import java.util.ArrayList;
import java.util.List;

/**
 * Class to read documents
 *
 * @author Mubin Shrestha
 */
public class DocumentParser {

    //This variable will hold all terms of each document in an array.
    private List termsDocsArray = new ArrayList<>();
    private List allTerms = new ArrayList<>(); //to hold all terms
    private List tfidfDocsVector = new ArrayList<>();

    /**
     * Method to read files and store in array.
     * @param filePath : source file path
     * @throws FileNotFoundException
     * @throws IOException
     */
    public void parseFiles(String filePath) throws FileNotFoundException, IOException {
        File[] allfiles = new File(filePath).listFiles();
        BufferedReader in = null;
        for (File f : allfiles) {
            if (f.getName().endsWith(".txt")) {
                in = new BufferedReader(new FileReader(f));
                StringBuilder sb = new StringBuilder();
                String s = null;
                while ((s = in.readLine()) != null) {
                    sb.append(s);
                }
                String[] tokenizedTerms = sb.toString().replaceAll("[\\W&&[^\\s]]", "").split("\\W+");   //to get individual terms
                for (String term : tokenizedTerms) {
                    if (!allTerms.contains(term)) {  //avoid duplicate entry
                        allTerms.add(term);
                    }
                }
                termsDocsArray.add(tokenizedTerms);
            }
        }

    }

    /**
     * Method to create termVector according to its tfidf score.
     */
    public void tfIdfCalculator() {
        double tf; //term frequency
        double idf; //inverse document frequency
        double tfidf; //term requency inverse document frequency        
        for (String[] docTermsArray : termsDocsArray) {
            double[] tfidfvectors = new double[allTerms.size()];
            int count = 0;
            for (String terms : allTerms) {
                tf = new TfIdf().tfCalculator(docTermsArray, terms);
                idf = new TfIdf().idfCalculator(termsDocsArray, terms);
                tfidf = tf * idf;
                tfidfvectors[count] = tfidf;
                count++;
            }
            tfidfDocsVector.add(tfidfvectors);  //storing document vectors;            
        }
    }

    /**
     * Method to calculate cosine similarity between all the documents.
     */
    public void getCosineSimilarity() {
        for (int i = 0; i < tfidfDocsVector.size(); i++) {
            for (int j = 0; j < tfidfDocsVector.size(); j++) {
                System.out.println("between " + i + " and " + j + "  =  "
                                   + new CosineSimilarity().cosineSimilarity
                                       (
                                         tfidfDocsVector.get(i), 
                                         tfidfDocsVector.get(j)
                                       )
                                  );
            }
        }
    }
}


This is the class that calculates Cosine Similarity:

//CosineSimilarity.java
/*
 * To change this template, choose Tools | Templates
 * and open the template in the editor.
 */
package com.computergodzilla.tfidf;

/**
 * Cosine similarity calculator class
 * @author Mubin Shrestha
 */
public class CosineSimilarity {

    /**
     * Method to calculate cosine similarity between two documents.
     * @param docVector1 : document vector 1 (a)
     * @param docVector2 : document vector 2 (b)
     * @return 
     */
    public double cosineSimilarity(double[] docVector1, double[] docVector2) {
        double dotProduct = 0.0;
        double magnitude1 = 0.0;
        double magnitude2 = 0.0;
        double cosineSimilarity = 0.0;

        for (int i = 0; i < docVector1.length; i++) //docVector1 and docVector2 must be of same length
        {
            dotProduct += docVector1[i] * docVector2[i];  //a.b
            magnitude1 += Math.pow(docVector1[i], 2);  //(a^2)
            magnitude2 += Math.pow(docVector2[i], 2); //(b^2)
        }

        magnitude1 = Math.sqrt(magnitude1);//sqrt(a^2)
        magnitude2 = Math.sqrt(magnitude2);//sqrt(b^2)

        if (magnitude1 != 0.0 | magnitude2 != 0.0) {
            cosineSimilarity = dotProduct / (magnitude1 * magnitude2);
        } else {
            return 0.0;
        }
        return cosineSimilarity;
    }
}


Here's the main class to run the code:

//TfIdfMain.java
package com.computergodzilla.tfidf;

import java.io.FileNotFoundException;
import java.io.IOException;

/**
 *
 * @author Mubin Shrestha
 */
public class TfIdfMain {
    
    /**
     * Main method
     * @param args
     * @throws FileNotFoundException
     * @throws IOException 
     */
    public static void main(String args[]) throws FileNotFoundException, IOException
    {
        DocumentParser dp = new DocumentParser();
        dp.parseFiles("D:\\FolderToCalculateCosineSimilarityOf"); // give the location of source file
        dp.tfIdfCalculator(); //calculates tfidf
        dp.getCosineSimilarity(); //calculates cosine similarity   
    }
}


You can also download the whole source code from here: Download.

Overall what I did is, I first calculate the TfIdf matrix of all the documents and then document vectors of each documents. Then I used those document vectors to calculate cosine similarity.

You think clarification is not enough. Hit me..
Happy Text-Mining!!

Please check out my first Android app, NTyles:

Tuesday, June 18, 2013

Oracle 11g :Inheritance in Oralce PLSQL

Get real time news update from your favorite websites.
Don't miss any news about your favorite topic.
Personalize your app.

Check out NTyles.


Get it on....

NTyles-App

In my previous post I discussed a little about object oriented programming in oracle plsql. In previous post I gave a little example using OOP in oracle 11g.

In this post I will show you and give some example of one of the feature of the OOP, i.e Object Oriented Programming. The feature that I am going to show about is inheritance. I know all of you who worked with Java and .Net and other OOP languages must be familiar with Inheritance. And for those who don't know inheritance let me write something about it for you :

"Inheritance is that concept in OOP in oracle plsql, where a object or a relation inherits the specs i.e attributes (variables and methods) of another object. In oracle, inheritance relationship is established using primary-key and foriegn-key relationships(shared ID) in order to simulate the relationship between derived class and inherited class."

And if you guys are still wondering what an inheritance is , isn't there any one line sentence that I can understand whole thing, then I have one sentence for you :

We, humans are inherited from apes.

I now think you get the whole picture.


Let me take an opportunity to design a database for eBay,hehe, using Inheritance feature in oracle. Along the design process I will explain different types of inheritance features available in Oracle 11g. What I think about eBay is Users logs in, a logged in user may be buyer or bidder. Buyer is one who creates bid and Bidders are those who bids on the bids created by Buyer. (Everybody knows I am lazy and I am only talking this much for eBay. There are many other features too in eBay, but I think I will be able to describe inheritance in oracle plsql using user, buyer and bidder).

User logged in may be buyer and also a bidder. In inheritance this type of condition is know as
Union Inheritance.

1. Implementing Union Inheritance in Oracle 11g.

This is first design. All bidders and buyers are users and a user can be bidder or a buyer.

Now let me show you the script in oracle plsql using OOP implementing UNION INHERITANCE:

CREATE OR REPLACE TYPE users_obj AS OBJECT  --super object
(
    id       VARCHAR2(10),
    userName VARCHAR2(20),
    email    VARCHAR2(100),
    address  VARCHAR2(35)
) NOT FINAL
/  

CREATE TABLE users OF users_obj--table for users of eBay
(
    id NOT NULL,
    PRIMARY KEY (id)
); 

CREATE OR REPLACE TYPE buyers_obj UNDER users_obj  --inherited object for buyers
(
    bidscreated number
)
/

CREATE TABLE buyers OF buyers_obj  --table of buyers
(
    id NOT NULL,
    PRIMARY KEY (id)
);

CREATE OR REPLACE TYPE bidders_obj UNDER users_obj  --inherited object for bidders
(
    bidsapplied number
)
/

CREATE TABLE bidders OF bidders_obj  --table of bidders
(
    id NOT NULL,
    PRIMARY KEY (id)
);  


There may be users who just creates account and leave them without using them, being static. So, in this case there should be table to store these static users so as to inform them for the news like 'Hey, staic user you won a 1 month vacation to los angeles.'.

Now if the database was designed in classic way think of the problems that one has to face. One of the main advantage of Object Oriented Programming (OOP) is its reuseability. There's a requirement change that you have to face it and solve it.

 In inheritance terms this condition is known as Mutual Exclusion Inheritance.

2. Implementing Mutual Exclusion Inheritance in Oracle 11g.

Now let's move to second design to add table for static users. As we have created table Users I am use this to store information for static users who are neither buyer nor bidder.
Now there will be little change in script for creating Users table.Here's the script:

CREATE OR REPLACE TYPE users_obj AS OBJECT  --super object
(
    id        VARCHAR2(10),
    userName  VARCHAR2(20),
    email     VARCHAR2(100),
    address   VARCHAR2(35),
    user_type VARCHAR2(10)
) NOT FINAL
/  

CREATE TABLE users OF users_obj--table for users of eBay
(
    id NOT NULL,
    user_type CHECK (user_type in ('bidders', 'buyers', 'NULL')), --handling static users
    PRIMARY KEY (id)
); 

CREATE OR REPLACE TYPE buyers_obj UNDER users_obj  --inherited object for buyers
(
    bidscreated number
)
/

CREATE TABLE buyers OF buyers_obj  --table of buyers
(
    id NOT NULL,
    PRIMARY KEY (id)
);

CREATE OR REPLACE TYPE bidders_obj UNDER users_obj  --inherited object for bidders
(
    bidsapplied number
)
/

CREATE TABLE bidders OF bidders_obj  --table of bidders
(
    id NOT NULL,
    PRIMARY KEY (id)
);
Also, if eBay decides to make a new policy that every user must full into any of the role of the bidder, buyer or watchers then this situation is know as Partition Inheritance.

3. Implementing Partition Inheritance in Oracle 11g.

Third design includes the new table for watchers.

CREATE OR REPLACE TYPE users_obj AS OBJECT  --super object
(
    id        VARCHAR2(10),
    userName  VARCHAR2(20),
    email     VARCHAR2(100),
    address   VARCHAR2(35),
    user_type VARCHAR2(10)
) NOT FINAL
/  

CREATE TABLE users OF users_obj--table for users of eBay
(
    id NOT NULL,
    user_type CHECK (user_type in ('bidders', 'buyers', 'watchers')), --handelling watcher users
    PRIMARY KEY (id)
); 

CREATE OR REPLACE TYPE buyers_obj UNDER users_obj  --inherited object for buyers
(
    bidscreated number
)
/

CREATE TABLE buyers OF buyers_obj  --table of buyers
(
    id NOT NULL,
    PRIMARY KEY (id)
);

CREATE OR REPLACE TYPE bidders_obj UNDER users_obj  --inherited object for bidders

(
    bidsapplied number
)
/

CREATE TABLE bidders OF bidders_obj  --table of bidders
(
    id NOT NULL,
    PRIMARY KEY (id)
);

CREATE OR REPLACE TYPE watchers_obj UNDER users_obj  --inherited object for bidders
(
    favItems number
)
/

CREATE TABLE watchers OF watchers_obj  --table of bidders
(
    id NOT NULL,
    PRIMARY KEY (id)
);

Designing database using Object Oriented Features needs a bit high level thinking and needs model thinking. Designers should try to make database model according to the real world model and tables and design should encompass with the requirement change and changes in surrounding.

Well I finished some level of eBay database design , hehe.

 Happy Objecting In Oracle!!

Thursday, May 30, 2013

Oracle 11g : Object Oriented Programming In Oracle PLSQL

Get real time news update from your favorite websites.
Don't miss any news about your favorite topic.
Personalize your app.

Check out NTyles.


Get it on....

NTyles-App

Before I took the job as the Associate Software Engineer, I was a JAVA and .NET guy.
All the projects that I did before my current job, I did them JAVA or either .NET. In those time object was my play thing. Everything I do in my project I used to think in object way.I know how powerful  object oriented programming is.

Currently I am a oracle plsql developer. And as soon as I get this job I tried to model data in my own way as I used to do in JAVA and .NET. And I was very happy to find out that Oracle too has object oriented features.

Let me show you a quick code demo that uses oracle's object oriented features.
The gist of code is  :

"If I am two numbers then I can be added, subtracted, multiplied and divided."

Now here goes the code:

--this is object type with two number variables. 
--as in java one can define constructor, member functions
--and yes, setters and getters.
--i am not showing all of them coz i am lazy

CREATE OR REPLACE TYPE numbers AS object
(
    a NUMBER,
    b NUMBER
);

Upto this what I did is I created a number Object.
Think something like this :

"If I have a car, I can drive it, and of course I can sell it too." 

So, If I have numbers then I can add them, divided them , subtract them and yes multiply them. Here's the code that does all the above mentioned.

 (See think objectly , everything will look simple and programming would be so easy.)

--This is another object that does all the operation for numbers object.
--This is definition spec.
CREATE OR REPLACE TYPE numbersOp AS object
(
    n numbers, --my numbers object

    --this is how one defines member functions in oracle.
    member FUNCTION plus RETURN NUMBER ,    --add
    member FUNCTION sub RETURN NUMBER,      --subtract 
    member FUNCTION multiply RETURN NUMBER, --multiply
    member FUNCTION divide RETURN NUMBER    --divide
);
/

--This is body spec.
CREATE OR REPLACE TYPE BODY numbersOp as
  member FUNCTION plus RETURN NUMBER AS
   vblsum NUMBER ;
   BEGIN
     vblsum := n.a + n.b;
     RETURN vblsum;
   --EXCEPTION
   --  WHEN Others THEN
   END plus ;

   member FUNCTION sub RETURN NUMBER AS
    vblsub NUMBER;
     BEGIN
       vblsub := n.b - n.a;
       RETURN vblsub;
     --EXCEPTION
     --  WHEN Others THEN
     END sub;

   member FUNCTION multiply RETURN NUMBER AS
    vblmul NUMBER ;
     BEGIN
       vblmul := n.a * n.b;
       RETURN vblmul;
     --EXCEPTION
     --  WHEN Others THEN
     END;

   member FUNCTION divide RETURN NUMBER AS
    vbldiv NUMBER (10, 3);
     BEGIN
       vbldiv := n.a / n.b ;
       RETURN vbldiv;
     --EXCEPTION
     --  WHEN Others THEN
     END;

END ;
 / 

Now everything has been coded for numbers and it operations. Now let see some demo. Here's the demo code:


DECLARE

  a numbers := numbers(25, 60); --my numbers
  b numbersOp := numbersOp(a);  --I should able to operate them
BEGIN

   Dbms_Output.Put_Line(b.plus);
   Dbms_Output.Put_Line(b.sub);
   Dbms_Output.Put_Line(b.multiply);
   Dbms_Output.Put_Line(b.divide);
--EXCEPTION
--  WHEN Others THEN
END;


If you really find this stuff interesting, then my next blog will make u addicted to the object oriented concepts in oracle.
Till then
HAPPY OBJECTING IN ORACLE!!.

Saturday, May 25, 2013

MS Chart Control : Create user control of chart control.

Get real time news update from your favorite websites.
Don't miss any news about your favorite topic.
Personalize your app.

Check out NTyles.


Get it on....

NTyles-App


In my previous post DataVisualization with Chart Control I show you how to use MS Chart Control for data visualization and some of its features. In this post I will show you how to make a chart user control. Chart user control can be very handy when you have multiple pages that will access the same control and you want the output accordingly. According to the MSDN a user control is :

 "
In addition to using Web server controls in your ASP.NET Web pages, you can create your own custom, reusable controls using the same techniques you use for creating ASP.NET Web pages. These controls are called user controls.
A user control is a kind of composite control that works much like an ASP.NET Web page—you can add existing Web server controls and markup to a user control, and define properties and methods for the control. You can then embed them in ASP.NET Web pages, where they act as a unit.
"
                                                              -

User Control is a very powerful feature of .NET FRAMEWORK.
I have below described how to make a user control , add a chart control to it and use it in your web pages. Here are the steps on how to create a chart user control.

STEP 1: Add a web user control in your project.
  1. First left click on the project in which you want to add a user control as shown in Figure 1.
  2. Choose Add New Item and from web template choose web user control , give a suitable name and click add as shown in Figure 1.2.
  3. Now add a chart control from a toolbox to the user control as shown in Figure 1.3.
  4. Then configure data source of your chart. If you don't know how to configure data source then please check out Cofigure Data Source.
Figure 1 : Add a new item.


Figure 1.2 : Choose a "Web User Control"


Figure : 1.3 : Add a chart Control to a web user control.


Upto this step the script should like (ChartUserControl.ascx) :
<%@ Control Language="C#" AutoEventWireup="true" CodeBehind="ChartUserControl.ascx.cs" Inherits="ChartUserControl.ChartUserControl" %>
<%@ Register assembly="System.Web.DataVisualization, Version=4.0.0.0, Culture=neutral, PublicKeyToken=31bf3856ad364e35" namespace="System.Web.UI.DataVisualization.Charting" tagprefix="asp" %>
<asp:Chart ID="userControlChart" runat="server" Height="408px" Width="686px" DataSourceID="Heights">
    <series>
        <asp:Series Name="Series1" XValueMember="name" YValueMembers="height"> </asp:Series>
    </series>
    <chartareas>
        <asp:ChartArea Name="userControlChartArea">
        </asp:ChartArea>
    </chartareas>
    <Legends>
        <asp:Legend Name="ChartLegend">
        </asp:Legend>
    </Legends>
    <Titles>
        <asp:Title Name="ucFinalTitle">
        </asp:Title>
    </Titles>
</asp:Chart>

<asp:SqlDataSource ID="Heights" runat="server"
    ConnectionString="<%$ ConnectionStrings:ConnectionString %>
" SelectCommand="SELECT [name], [height] FROM [Heights]">
</asp:SqlDataSource>

Now add the variables for controls that you want to the chart. These are those controls that are set and get from other web pages, from which you want to access the chart user control. So below is the code snippet of the control that I have added to control the behaviour of the chart user control. If you guys want to add more controls then go on adding variables and manipulate them.
//CharUserControl.ascx.cs

using System;
using System.Collections.Generic;
using System.Linq;
using System.Web;
using System.Web.UI;
using System.Web.UI.WebControls;
using System.Data;
using System.Web.UI.DataVisualization.Charting;

namespace ChartUserControl
{
    public partial class ChartUserControl : System.Web.UI.UserControl
    {
        /// 
        /// Defining all the properties of chart that you want to control.
        /// You may add or remove the properties which you are not willing to use.    
        /// 
        /// 
        /// 
        public String  ChartTitle { get; set; }
        public String  ChartTypeofchart { get; set; }
        public String  ChartName { get; set; }
        public String  ChartBackGroundColor { get; set; }
        public String  ChartSeriesColor { get; set; }
        public String  xaxistitle { get; set; }
        public String  yaxistitle { get; set; }
        public Boolean enable3d { get; set; }
        public Boolean enablelegend { get; set; }
        public int     xaxisinterval { get; set; }
        public String  legendtitle { get; set; }
        public String  xaxisvaluemember { get; set; }

        protected void Page_Load(object sender, EventArgs e)
        {
            userControlChart.ViewStateMode = System.Web.UI.ViewStateMode.Enabled;
        }

        public void createChart()
        {

            //sets the chart title
            userControlChart.Titles["ucFinalTitle"].Text = ChartTitle;
            //for enalbling the legend
            userControlChart.Legends["ChartLegend"].Enabled = true;
            userControlChart.Series["Series1"].LegendText = legendtitle;
            //set axis interval
            userControlChart.ChartAreas["userControlChartArea"].AxisX.Interval = xaxisinterval;
            //Type Of Chart
            #region chartType Region
            if (ChartTypeofchart == "Column")
                userControlChart.Series["Series1"].ChartType = SeriesChartType.Column;
            if (ChartTypeofchart == "Bar")
                userControlChart.Series["Series1"].ChartType = SeriesChartType.Bar;
            if (ChartTypeofchart == "Stacked")
                userControlChart.Series["Series1"].ChartType = SeriesChartType.StackedBar;
            if (ChartTypeofchart == "Pie")
                userControlChart.Series["Series1"].ChartType = SeriesChartType.Pie;
            if (ChartTypeofchart == "Area")
                userControlChart.Series["Series1"].ChartType = SeriesChartType.Area;
            if (ChartTypeofchart == "BoxPlot")
                userControlChart.Series["Series1"].ChartType = SeriesChartType.BoxPlot;
            if (ChartTypeofchart == "Line")
                userControlChart.Series["Series1"].ChartType = SeriesChartType.Line;
            if (ChartTypeofchart == "Point")
                userControlChart.Series["Series1"].ChartType = SeriesChartType.Point;
            if (ChartTypeofchart == "Spline")
                userControlChart.Series["Series1"].ChartType = SeriesChartType.Spline;
            #endregion
            #region Axis Titles
            //value shown as label
            userControlChart.Series["Series1"].IsValueShownAsLabel = true;
            //xaxis title
            userControlChart.ChartAreas["userControlChartArea"].Axes[0].Title = xaxistitle;
            //yaxis title
            userControlChart.ChartAreas["userControlChartArea"].Axes[1].Title = yaxistitle;
            #endregion
            #region legend text
            //Legend Text
            userControlChart.Series["Series1"].LegendText = xaxisvaluemember;
            #endregion
            #region chart BackGround color
            if (ChartBackGroundColor == "Black")
                userControlChart.BackColor = System.Drawing.Color.Black;
            if (ChartBackGroundColor == "Blue")
                userControlChart.BackColor = System.Drawing.Color.Blue;
            if (ChartBackGroundColor == "Green")
                userControlChart.BackColor = System.Drawing.Color.Green;
            if (ChartBackGroundColor == "Red")
                userControlChart.BackColor = System.Drawing.Color.Red;
            if (ChartBackGroundColor == "Yellow")
                userControlChart.BackColor = System.Drawing.Color.Yellow;
            if (ChartBackGroundColor == "Pink")
                userControlChart.BackColor = System.Drawing.Color.Pink;
            if (ChartBackGroundColor == "AliceBlue")
                userControlChart.BackColor = System.Drawing.Color.AliceBlue;
            if (ChartBackGroundColor == "Aqua")
                userControlChart.BackColor = System.Drawing.Color.Aqua;
            if (ChartBackGroundColor == "Aquamarine")
                userControlChart.BackColor = System.Drawing.Color.Aquamarine;
            if (ChartBackGroundColor == "Brown")
                userControlChart.BackColor = System.Drawing.Color.Brown;
            if (ChartBackGroundColor == "Chocolate")
                userControlChart.BackColor = System.Drawing.Color.Chocolate;
            if (ChartBackGroundColor == "DarkBlue")
                userControlChart.BackColor = System.Drawing.Color.DarkBlue;
            if (ChartBackGroundColor == "DarkCyan")
                userControlChart.BackColor = System.Drawing.Color.DarkCyan;
            if (ChartBackGroundColor == "Darkviolet")
                userControlChart.BackColor = System.Drawing.Color.DarkViolet;
            if (ChartBackGroundColor == "Ivory")
                userControlChart.BackColor = System.Drawing.Color.Ivory;
            if (ChartBackGroundColor == "Azure")
                userControlChart.BackColor = System.Drawing.Color.Azure;
            if (ChartBackGroundColor == "DimGray")
                userControlChart.BackColor = System.Drawing.Color.DimGray;
            userControlChart.ChartAreas["userControlChartArea"].BackColor = System.Drawing.Color.AliceBlue;
            #endregion
            #region chart Series Color

            if (ChartSeriesColor == "Black")
                userControlChart.Series["Series1"].Color = System.Drawing.Color.Black;
            if (ChartSeriesColor == "Blue")
                userControlChart.Series["Series1"].Color = System.Drawing.Color.Blue;
            if (ChartSeriesColor == "Green")
                userControlChart.Series["Series1"].Color = System.Drawing.Color.Green;
            if (ChartSeriesColor == "Red")
                userControlChart.Series["Series1"].Color = System.Drawing.Color.Red;
            if (ChartSeriesColor == "Yellow")
                userControlChart.Series["Series1"].Color = System.Drawing.Color.Yellow;
            if (ChartSeriesColor == "Pink")
                userControlChart.Series["Series1"].Color = System.Drawing.Color.Pink;
            if (ChartSeriesColor == "AliceBlue")
                userControlChart.Series["Series1"].Color = System.Drawing.Color.AliceBlue;
            if (ChartSeriesColor == "Aqua")
                userControlChart.Series["Series1"].Color = System.Drawing.Color.Aqua;
            if (ChartSeriesColor == "Aquamarine")
                userControlChart.Series["Series1"].Color = System.Drawing.Color.Aquamarine;
            if (ChartSeriesColor == "Brown")
                userControlChart.Series["Series1"].Color = System.Drawing.Color.Brown;
            if (ChartSeriesColor == "Chocolate")
                userControlChart.Series["Series1"].Color = System.Drawing.Color.Chocolate;
            if (ChartSeriesColor == "DarkBlue")
                userControlChart.Series["Series1"].Color = System.Drawing.Color.DarkBlue;
            if (ChartSeriesColor == "DarkCyan")
                userControlChart.Series["Series1"].Color = System.Drawing.Color.DarkCyan;
            if (ChartSeriesColor == "Darkviolet")
                userControlChart.Series["Series1"].Color = System.Drawing.Color.DarkViolet;
            if (ChartSeriesColor == "Ivory")
                userControlChart.Series["Series1"].Color = System.Drawing.Color.Ivory;
            if (ChartSeriesColor == "Azure")
                userControlChart.Series["Series1"].Color = System.Drawing.Color.Azure;
            if (ChartSeriesColor == "DimGray")
                userControlChart.Series["Series1"].Color = System.Drawing.Color.DimGray;
            #endregion
            #region Enable 3D
            userControlChart.ChartAreas["userControlChartArea"].Area3DStyle.Enable3D = enable3d;
            #endregion
            #region enableLegend
            userControlChart.Legends["ChartLegend"].Enabled = enablelegend;
            #endregion
            ///Enable viewing            
            userControlChart.EnableViewState = true;
        }
    }
}
STEP 2: Edit web.config.
  1. Open web.config and add :
     <add src="~/ChartUserControl.ascx" tagname="ucChartUserControl" tagprefix="uc" />
     
    inside <Controls>  <Controls/>
    
The script in web.config should look like this:
    <pages>
      <controls>
        <add tagPrefix="asp" namespace="System.Web.UI.DataVisualization.Charting"
          assembly="System.Web.DataVisualization, Version=4.0.0.0, Culture=neutral, PublicKeyToken=31bf3856ad364e35" />
          <add tagPrefix="uc" tagName="ucChartUserControl" src="~/ChartUserControl.ascx" />
      </controls>
    </pages>
STEP 3: Add user control to the pages in which you want the controls
  1. Identify the location where you want to display your chart.
  2. From Solution explorer click on the ChartUserControl.ascx and drag it to the location in your web page where you want to display the chart. In my case I have added two control in the page Demo1.aspx as shown in Figure 3.1. After you drag and drop your usercontrol in the design view then .net will generate script in your source view as below:
     <uc:ucChartUserControl ID="ucChartUserControl1" runat="server" />
    
Figure 3.1 : Drag and Drop user control to desired pages.

In my case I have added two user control in the same page and a button for controlling the user controls. The source view of my demo1.aspx is as below :
<%@ Page Language="C#" AutoEventWireup="true" CodeBehind="Demo1.aspx.cs" Inherits="ChartUserControl.ChartDemos.Demo1"
    MasterPageFile="~/Site.Master" %>

<asp:Content ID="HeaderContent" runat="server" ContentPlaceHolderID="HeadContent">
</asp:Content>
<asp:Content ID="BodyContent" runat="server" ContentPlaceHolderID="MainContent">
    <div>
        <div>
            <div>
                <uc:ucChartUserControl ID="ucChartUserControl1" runat="server" />
            </div>
            <div>
                <uc:ucChartUserControl ID="ucChartUserControl2" runat="server" />
            </div>
        </div>
        <div>
            <asp:Button ID="Button1" runat="server" Text="Change Chart" OnClick="changeChart" />
        </div>
    </div>
</asp:Content>
STEP 4 : Control User Control behaviour I am firing an event from my asp button that will change the color, name, legend 3d style and many more. Here's the code (Demo1.aspx.cs):
using System;
using System.Collections.Generic;
using System.Linq;
using System.Web;
using System.Web.UI;
using System.Web.UI.WebControls;

namespace ChartUserControl.ChartDemos
{
    public partial class Demo1 : System.Web.UI.Page
    {
        protected void Page_Load(object sender, EventArgs e)
        {

        }

        protected void changeChart(object sender, EventArgs e)
        {
            setFirstChart();
            setSecondChart();
        }

        public void setFirstChart()
        {
            ucChartUserControl1.ChartSeriesColor = "Red";
            ucChartUserControl1.ChartTitle = "This is demo of chart user control";
            ucChartUserControl1.ChartTypeofchart = "Bar";
            ucChartUserControl1.ChartName = "UserControlChart";
            ucChartUserControl1.ChartBackGroundColor = "Yellow";
            ucChartUserControl1.xaxistitle = "Name";
            ucChartUserControl1.yaxistitle = "Height";
            ucChartUserControl1.xaxisvaluemember = "Name";
            ucChartUserControl1.enable3d = true;
            ucChartUserControl1.enablelegend = true;
            ucChartUserControl1.legendtitle = "Rambo Legend";
            ucChartUserControl1.xaxisinterval = 1;
            ucChartUserControl1.createChart();
        }

        public void setSecondChart()
        {
            ucChartUserControl2.ChartSeriesColor = "Black";
            ucChartUserControl2.ChartTitle = "This is demo of chart user control 2";
            ucChartUserControl2.ChartTypeofchart = "Pie";
            ucChartUserControl2.ChartName = "UserControlChart 2";
            ucChartUserControl2.ChartBackGroundColor = "Blue";
            ucChartUserControl2.xaxistitle = "Name";
            ucChartUserControl2.yaxistitle = "Height";
            ucChartUserControl2.xaxisvaluemember = "Name";
            ucChartUserControl2.enable3d = false;
            ucChartUserControl2.enablelegend = true;
            ucChartUserControl2.legendtitle = "Rambo Spline Legend";
            ucChartUserControl2.xaxisinterval = 1;
            ucChartUserControl2.createChart();
        }
    }
}
All done now, run your code and analyse the output: I am showing you the output in my case (I am good designer and am a good liar too):
Figure 4.1 : Demo 1.

 and after clicking button:
Figure 4.2 : Final output.

 Please if you have any confusion don't forget to reach out to me.