Get real time news update from your favorite websites.
Don't miss any news about your favorite topic.
Personalize your app.
Get it on....
In my previous post I told you guys why MS Chart Control is a very cool API for data visualization in asp.net. In my series of posts, I will show you how to get on with the MS Chart Control. My post is generally for beginners who really want to make something out of data visualization. In this post I will show you how to first make a column chart using MS Chart Control.
So without further ado let me guide you to the way to the success for creating a chart in asp.net using Visual c sharp in Microsoft’s Visual Studio 2010.
Step 1 : Create a new web application Project (ASP.NET and Visual C#).
First of all create a new web application in asp.net and visual c# in Visual Studio 2010. If you guys know how to create a web application project in VS 2010 then you can skip this section.
1. Open Visual Studio 2010.
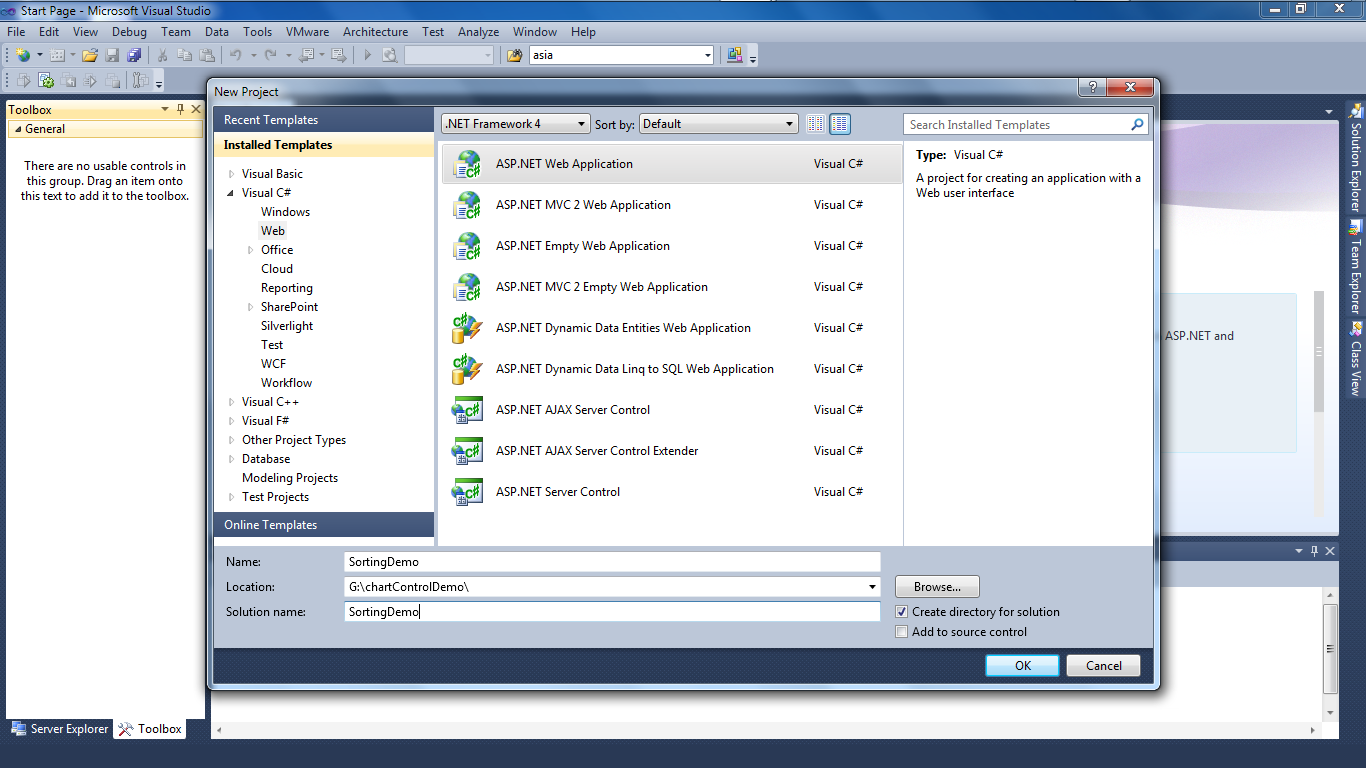
2. Go to File -> New Project. You will be welcomed by following window.
 |
| 1. Create a new web project . |
3. Choose ASP.NET web application with Visual C#.
4. Give name and location and solution name to your project and click OK.
Step 2 : Add a chart control to your web page.
 |
| 2. Welcome Screen after you create a web project |
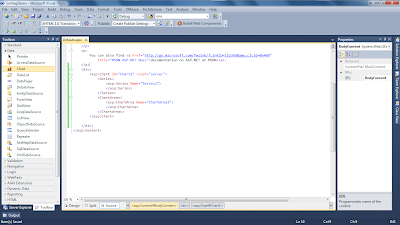
By default you will be welcomed with the Design view as shown in figure 2 which is a default template. If you to want to use your own template then you’re always welcome. Chart Control can be directly drag and dropped to the desing view but what I suggest is to use source view for drag and dropping because from here you can manage your code and you can also give '<div></div>' tags for CSS insertions, hehe , in the project. This really makes your source view manageable. But mine is not the only way, you can follow whatever method you want to follow. Now here are the step how to add a chart control to your source view.
- Go to the source view.
- Drag and drop the ‘Chart’ tool from the Toolbox, the chart tool is shown in fig 3.
 |
| 3. Add a chart control to source view. |
Step 3: Make some data to test on.
Now you added a chart. But your chart control needs data to display the chart upon. So, here I am creating a test data in MS SQL Server. If you already have data which you want to visualize then you can use them too. Here I am showing you how to build a sql server table and insert some data in to it.
- Open solution explorer window.
- Left Click on App_Data -> Add -> New Item shown in fig 4.
- Select SQL Server Database and Click Next.
- Now open Server Explorer. Unfold the SortDemo.mdf icon as shown in fig 5.
- Left click on Tables and Choose Add New Table.
- Define table constraints and data structure, for example take a look at fig 6..
- Left click on new formed tables and choose ‘Show Table Data’ as shown in fig 7.
- Now insert some data in table as shown in fig 8.
Step 3 : Assign data to the chart
- Go to the 'Design view'.
- Click on the chart area. You will see a small arrow like icon.
- Click on that icon. A small chart Tasks area will appear as shown in fig 9.
- From Data Source Drop Down menu choose <New Data Source>.
- Then Data Source Configuration Wizard appears as shown in fig 10.
- Choose ‘SQL Database’ and give a name for the Data Source and Click OK as shown in fig 11.
- If you want to save the connection String then save it or just Click Next > as shown in fig 12.
- Check the checkbox that shows ‘* ‘ and Click Next > as shown in fig 13.
- Test. If everything is 'ok' then click Finish as shown in fig 14.
 |
| 9. Assign data source to chart - 1. |
 |
| 10. Assign data source to chart - 2. |
 |
| 11 . Assign data source to chart - 3. |
 |
| 12. Assign data source to chart - 4. |
 |
| 13 . Assign data source to chart - 5. |
 |
| 14 . Assign data source to chart - 6. |
 |
| 15 . Assign data source to chart - 7. |
 |
| 16 . Assign data source to chart - 8. |
Step 4: Give data to the chart, data of which you want to generate chart.
- From Chart Type Drop Down Menu choose the type of chart which you want to display. Here I am choosing Column chart as shown in fig 15. You can also choose other chart types too like :
- Pie
- Bar
- Doughnut
- Spline
- Stacked
- Assign data members to x-axis and y-axis. Choose X Value Member and Y Value Members as shown in fig 16.
Now you’re done. Click on
Debug ->
Start without Debugging. And if everything is ok you will be welcomed by following web page as shown in fig 17.
 |
| 17. Chart Demo |
Have fun with this cool api. In my next post I will show you some cool features of MS Chart Control using the code behind.


No comments:
Post a Comment